Plot Value on Axis |
  
|
| Show/Hide Hidden Text |
Plot Value on Axis |
|
| Show/Hide Hidden Text |
This Graph menu command constructs, on one or more paths, one or more plotted points determined by value(s) you select or type.
If you select the value(s) or path(s) before choosing the command, Sketchpad constructs the plotted point(s) immediately.
Otherwise, a dialog box appears so that you can designate a value to be plotted and the path on which to plot it. (If you choose Graph | Plot Value in a sketch with no visible axes or paths, Sketchpad will offer to create new coordinate axes to permit plotting values.)
The position of a plotted point on a path depends on the path. For instance, you can plot values between 0 and 1 on a segment, you can plot values greater than or equal to zero on a ray, and you can plot any value on a line. See the Measure | Value of Point command for details of how values are defined on various path objects.
The Plot Value on Axis command takes several forms, depending on the selected objects.
Selection(s) |
Command |
Result |
One or more values and one path |
Plot Value on Path* |
Immediately plots the selected value on the selected path. |
One value and multiple paths |
Plot Value on Paths* |
Immediately plots the selected value on each selected path. |
One path |
Plot Value on Path...* |
Opens the Plot Value dialog box using the selected path. |
Other |
Plot Value on Axis... |
Opens the Plot Value dialog box. |
*With these selections, the command name changes to describe the selected path(s).
When the Plot Value dialog box appears, enter the appropriate value and path.
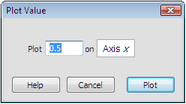
Type a number in the entry field on the left to plot a fixed value, or click in the sketch on a value (or a Hot Text link to a value) to plot that value.
The initial object in the entry field on the right is either the path you selected or Axis x if you didn’t select a path. Click a path object in the sketch to plot the value on that object.
When you’ve filled in the entry fields properly, click Plot to plot the point on the path.
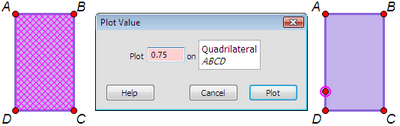
In the example below, only the quadrilateral ABCD is selected, so the Plot Value dialog box appears to allow you to enter a value. As a result of typing the value 0.75, the resulting plotted point is 0.75 of the way around the perimeter of the quadrilateral.(The perimeter starts at the first vertex, point A, and continues around the remaining vertices in the order in which they were selected to construct the quadrilateral.)
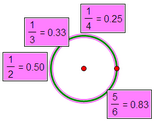
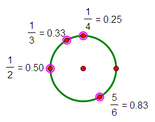
In the example below, a circle and four values are selected. The result of the command is to immediately plot all four values on the circumference of the circle, with a value of 1 corresponding to the entire circumference. (The value of a point on a circle measures counter-clockwise revolutions around the circle starting from the point directly to the right of the center.)
In the example below, three segments and one value are selected. The result of the command is to immediately plot the value on all three segments.
|
Other plotting commands:
Plot Points/Plot as (x, y)/Plot as (r, θ) command