Function Plots |
  
|
| Show/Hide Hidden Text |
Function Plots |
|
| Show/Hide Hidden Text |
A function plot shows the graph of a particular function on a coordinate system.
A function plot appears in the form determined by the Calculator’s Equation pop-up menu at the time the function was created or edited.
To change the form of an existing function plot, double-click the function itself to open the Calculator. Then choose a new form from the Equation pop-up menu.
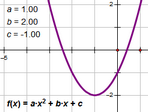
y = f(x) |
This is the default form. |
x = f(y) |
Use this form to plot the y = f(x) function with the axes reversed. |
r = f(θ) θ = f(r) |
You’ll normally use these two forms with a polar grid. |
You can change the object properties, label properties, and display attributes of function plots.
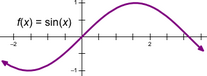
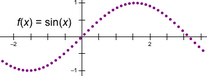
You can change the line style of continuous function plots, and you can change the point style of discrete function plots.
You can choose Edit | Properties | Plot to change the number of samples used to display a function plot and to change whether it’s displayed continuously or discretely.
To plot an existing function, select it and choose Graph | Plot Function. To define a new function and plot it immediately, choose Graph | Plot New Function. Sketchpad’s function Calculator appears; use it to define the function. Functions are plotted on the marked coordinate system. If there is no coordinate system, Sketchpad creates one. |
•Construct a point on a function plot using the Point tool or the Construct | Point on Object command. You can then animate the point along the function plot or use the point in any other way you like. •Use a function plot as a path along which to animate an independent point by using the Edit | Merge command. •Use Construct | Intersection to construct the intersection of a function plot with a straight object, a circle, an arc, or another function plot using the same horizontal axis. Alternatively, click the intersection with the Arrow tool or with any tool that can construct a point.
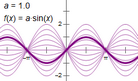
•Use Construct | Family of Functions to construct a family of functions. The function definition must use a parameter or slider. |
When you plot a function, the domain is initially set to the width of the Sketchpad window. To change the domain, you can: •Select the function plot, choose Edit | Properties | Plot, and enter new values for the ends of the domain. •Use the Arrow tool to drag the arrowheads that appears at the ends of the function plot. Drag in the direction that the arrowhead points to increase the length of the plot; drag in the opposite direction to decrease the length of the plot.
|
Mathematically, a function plot may include an infinite number of points. However, to display an infinite number of points would require a computer to use an infinite amount of time, so Sketchpad instead plots a large (but not infinite) number of points. Each point that Sketchpad does display is called a sample. To change the number of samples for a selected function plot: •Press the + or – key. Each press of the key increases or decreases the number of samples. •Choose Increase Resolution or Decrease Resolution from the Context menu. •Choose Edit | Properties | Plot and type a new value for the number of samples. You can change the initial number of samples for newly constructed function plots. Choose Edit | Advanced Preferences | Sampling and type a new value for Number of samples for new function plots. (This setting has no effect on already-existing function plots.) |
•Change between continuous and discrete display of a selected function plot by choosing Edit | Properties | Plot.
|