Tables |
  
|
| Show/Hide Hidden Text |
Tables |
|
| Show/Hide Hidden Text |
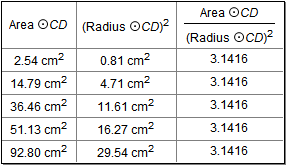
Use tables to examine how measurements, parameters, and calculations change over time. Tables are organized in rows and columns, with each column describing a single object, and each row containing the object’s value at the moment that the row was added to the table.
In addition to other single-valued measurements, you can tabulate functions, coordinates and equations.
Once you create a table, you can add rows to it one at a time, or you can instruct Sketchpad to collect rows automatically as you drag points or other objects that cause the tabulated values to change. You can also remove one or all rows from an existing table.
The last row of a table normally tracks current values as they change in the sketch. You can turn this feature on or off by choosing Edit | Properties | Table.
•To create a table, select one or more measured values — measurements, calculations, coordinate pairs, equations, or text containing values — and choose Number | Tabulate. •Sketchpad creates a table automatically when you create an iteration that causes one or more values to change. Such a table depends on the depth of the iteration; you cannot add rows manually. •To add a row to the table, capturing the current values of your tabulated measurements, double-click the table, or select the table and choose Number | Add Table Data. In the dialog box that appears, choose Add one entry now. •To capture changing values in a table automatically as you drag or animate measured objects in your sketch, choose Number | Add Table Data. Sketchpad displays a dialog box that lets you specify how many rows to add, and how frequently to add them. •To remove a table’s most recently added row, or to remove all of the rows from a table, select the table and choose Number | Remove Table Data. To remove a table’s most recently added row, you can also double-click a table with the Arrow tool while holding down the Shift key. •To change the labels of a table’s columns, change the name of the original measurement tabulated in that column. •To change the precision or units of a table’s data, change the precision or units of the original measurements tabulated by the table. •To change the color of a table’s borders, choose a color from the Display | Color submenu. •To change the color, font, size, or style of a table’s text, use the Text Palette. •To plot the data in a table, select the table and choose Graph | Plot Table Data. •To export the data in a table to another application such as Fathom Dynamic Data Software or Microsoft Excel, select the table and choose Edit | Copy. Switch to the other application and choose Paste. Sketchpad exports the table data to the other application as tab-delimited text. |