Using Functions |
  
|
| Show/Hide Hidden Text |
Using Functions |
|
| Show/Hide Hidden Text |
Once you've defined a function, you can use it in many ways: you can plot it, use it in a calculation or to define another function, edit it, differentiate it, trace its family, construct its family, transform it symbolically, transform its plot with a custom transformation, use it to define a composite function or a parametric plot, or create a sound button.
To define a new function and plot it immediately on the marked coordinate system, choose Graph | Plot New Function to open Sketchpad’s Calculator. Use it to define the function. When you close the Calculator, the function is plotted in the form that was set in the Calculator’s Equation pop-up menu. The function plot can take any of four possible forms.
To plot one or more existing functions on the marked coordinate system, select every function you want to plot and choose Graph | Plot Function. Each function is plotted in the form that was set in the Calculator’s Equation pop-up menu at the time you defined that function. |
|
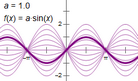
You can edit a symbolically defined function to change its definition or how it’s plotted. Editing a function is useful, for example, if you’ve plotted the graph of y = 2·sin(x), and you want to change the function to y = 3·sin(x) in order to see how the two graphs differ. Instead of changing the constant to 3, you can insert a new parameter, allowing you to investigate the plots of the family of functions y = a·sin(x). To edit a function, select that function, choose Edit | Edit Function, and use the Calculator to change the definition. You can also right-click (Win) or Ctrl-click (Mac) the function and choose Edit Function from the Context menu. When you edit a function, you can redefine it in any way you want — introducing new parameters and existing parameters, measurements and calculations — provided you don’t create a circular definition. (A circular definition is one that uses a calculation that depends on the function you’re editing. For instance, if you’ve defined a function f and used it to calculate f(3) in your sketch, you cannot later edit function f so that it uses the calculation of f(3) in its definition.) Choose a new equation form while editing a function to change how that function is plotted. For instance, to plot a function f as a polar function, use the Equation pop-up menu to change the form from y = f(x) to r = f(θ). |
To create the derivative of a function with respect to its independent variable, select the function, then choose Number | Define Derivative Function. The result is a derivative function that can be plotted or evaluated like any other function. |
Use parameters or sliders in a function definition to investigate families of functions. After you define the function and plot its graph, you can change or animate the parameter or slider, and observe or trace the family of functions. While you’re using the function Calculator to enter or edit a function, you can create a new parameter or use an existing parameter or other measurement from your sketch. When the value of this parameter or measurement changes, the definition of the function changes. For example, if you create parameter a while you’re specifying the function f(x) = a·sin (x), you can investigate the behavior and plots of this entire family of functions, including functions such as f(x) = –1·sin(x) and f(x) = 3·sin (x) by varying the parameter a. Similarly, use three parameters as you define the function f(x) = a·x2 + b·x + c to investigate how changing each parameter’s value affects the function plot. With the Calculator open add a new parameter to the function definition by choosing Number | New Parameter from the Calculator’s Values pop-up menu. Insert an existing parameter by clicking on it in the sketch. |
When you use a parameter or slider in a function definition, you can construct the family of functions. You must first plot the function itself. Then select both the function plot and the parameter or slider used in the function definition and choose Construct | Family of Functions. |
Once you’ve defined a function f(x) — for example, f(x) = x2 — you can define and plot other functions that are transformations of f(x). Transformations of f(x) include such functions as these:
To define a function that is a transformation of f(x), choose Number | New Function. Define the new function as you normally would, inserting the original function f wherever you want by clicking it in the sketch. |
|
Composite functions are functions of functions. For instance, h(x) = g(f(x)) is called the composition of functions g and f, and can be thought of as follows: “First evaluate function f at the input value. Then use this result as the input for function g. The result of evaluating g is the output of the composite function g(f(x)).” To compose two functions g and f, first define each function separately. Then choose Number | New Function and use the function Calculator to define the composite function h(x). Click the functions g and f in the sketch to enter them into the Calculator. If the Calculator is hiding f or g in the sketch, you may have to move the Calculator out of the way first. |
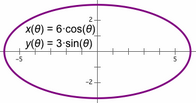
To create a parametric plot, define one function to represent the x value of a point and a second function to represent the y value. As the independent variable changes, the set of points determined by the values of the two functions defines the parametric plot. In this example, given any value of θ, the values of the two functions x(θ) and y(θ) determine a point. To construct the parametric plot, select these two defining functions and choose Graph | Plot Parametric Curve. The resulting plot is in the shape of an ellipse. |
To create a Sound button, define a mathematical function to describes air pressure over time. (The volume is determined by the amplitude of the function, and the pitch is determined by its period.) Then select the function and choose Edit | Action Buttons | Sound to create the button. (You can also select two functions to play a sound in stereo.) |